Deployment Pipeline Dashboard
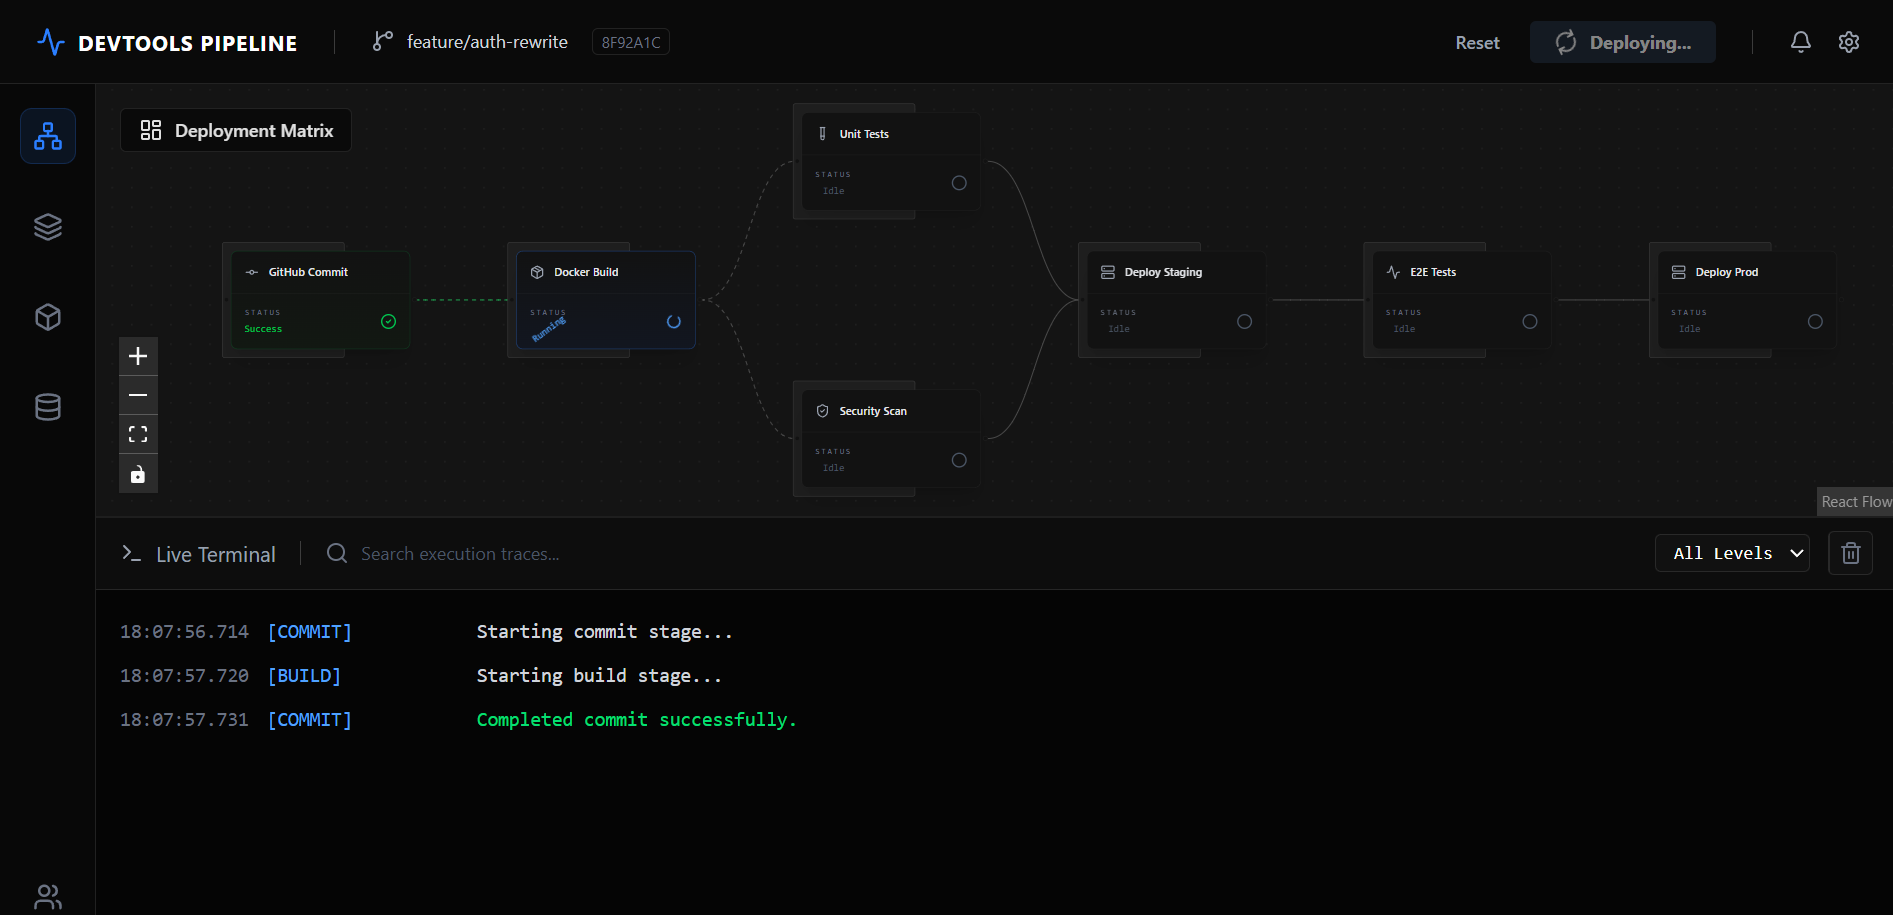
A real-time monitoring dashboard for a complex CI/CD deployment matrix, designed to instantly identify build failures across environments.
The Goal
Design and build a real-time monitoring interface for a complex CI/CD pipeline, allowing lead DevOps engineers to instantly trace build failures through dense streaming logs.
The Challenge
DevOps dashboards often suffer from overwhelming data density. The challenge was to present streaming log data, environment variables, and live system architecture without causing cognitive overload. We engineered a highly interactive React Flow and Zustand architecture to handle the complex state.
Technical Constraints
The interface needed to look and feel like a native developer tool. This meant adhering to strict monospace typography, high-contrast terminal-inspired color palettes, and optimizing the layout for extremely wide, data-rich viewports.
Business Impact
By significantly reducing the time it takes to parse deployment logs and identify the root cause of a failed build, this interface minimizes engineering downtime and accelerates shipping velocity.
Reflection
"Designing for engineers requires abandoning traditional 'clean UI' aesthetics in favor of raw utility. This project taught me how to use typographic hierarchy and subtle color coding to tame extreme data density."