High-Density Financial Ledger
A complex, interactive data table with advanced filtering, sorting, and inline editing, paired with a gorgeous financial chart.
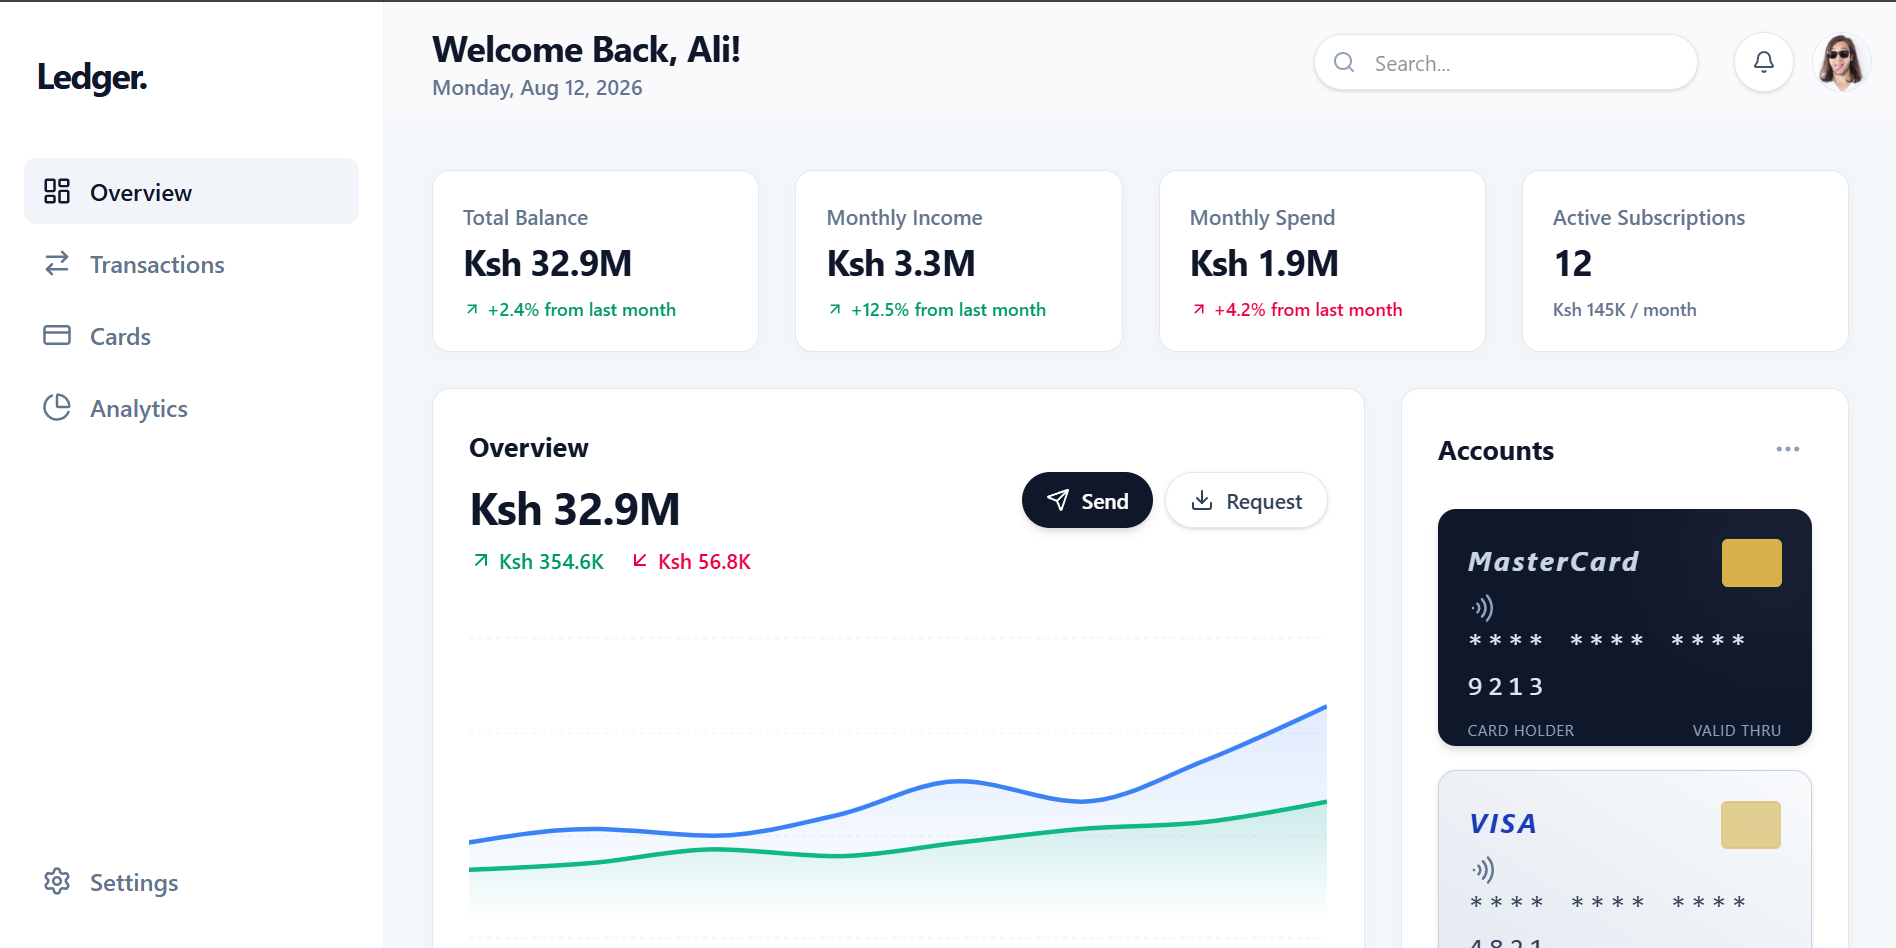
The Goal
Design and engineer a high-performance financial dashboard capable of rendering and managing thousands of fast-updating transactions without overwhelming the user.
The Challenge
Financial operations (FinOps) interfaces must balance macro-level analytics with micro-level transaction editing. The challenge was building a complex TanStack Table integration that supports global filtering and sorting while maintaining butter-smooth performance and an elegant, Bloomberg-inspired aesthetic.
Technical Constraints
Strict typographic rules for tabular numbers, complex React state management for the data grid, and integrating Recharts for responsive SVG financial charts.
Business Impact
By providing a highly polished, single-pane-of-glass view into financial movements, this ledger reduces reconciliation time and increases operational trust.
Reflection
"This project reinforced that in FinTech, bad design cannot hide. Typography, alignment, and rendering performance are the core tenets of financial trust."